Showing posts with label Price to Earnings Ratio. Show all posts

Wednesday, April 19, 2017

How to Select the Best Company with EPS Information?

Green rectangle depicts EPS

Actual Question:

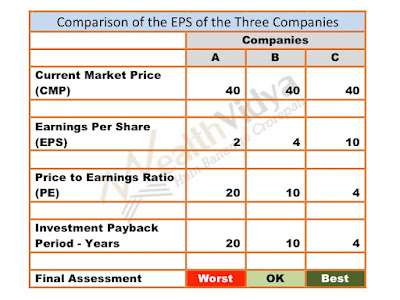
Companies A,B, C with Share Price 40 each and EPS is 2,4,10 respectively which one is better to invest and Why? Considering EPS is the only Factor.

Answer:

Dear Friend!

Thank you for the nice question.

Earnings Per Share (EPS) is one of the key parameter on which companies can be evaluated both individually as well as relatively.

However absolute figures of EPS are not readily comparable when the share prices are different. Luckily in your question you have kept the prices constant. Therefore, from the earnings per share and the market price we should draw a ver crucial as well as readily comparable information called the ‘Price to Earnings (PE) Ratio’.

The PE Ratio is obtained by dividing the current market price (CMP) by EPS. The PE Ratio as per standard value investing practices shall be any positive number that is below 15. Lower this number better it is. It should not be negative as only a negative EPS can yield a negative PE Ratio and a negative EPS menas the company has suffered a loss.

Now lets calculate the PE Ratios of all the three companies.
table showing calculation of price to earnings ratio of the three companies

It is evident from the above table that company C has the lowest positive PE ratio and therefore is the best. The PE Ratio of company B is below 15 and standing at 10 which is perfectly alright. Company A with a score of 20 (over 15) is the worst and therefore shall be rejected.

Incidentally the PE ratio also indicates in how many years the company earns back our investment. Therefore the lowest number is the best. Company C earns back the investment in four years (an ROI of 25%) which is wonderful.

One year EPS and PE Ratio can be by fluke and therefore misleading. therefore the PE Ratio computed from the average EPS of the last five years or the latest year, whichever is lower shall be considered.


Please note that besides the price to earnings ratio, for a thorough evaluation of a company, there are many more parameters that need to be considered. Following are some of the parameters:
  1. Price to Book Value
  2. Dividend Yield
  3. No or low indebtedness
  4. Distance from 52 week high
  5. Last five year share price returns
In conclusion best company can be selected from the EPS  and price information by computing the price to earnings ratio. Many other techniques also shall be employed complementary to the PE Ratio.

Thank you,

With Best Regards,

Anand


Saturday, March 25, 2017

Price to Earnings (PE) Ratio Calculator


Picture shows a calculator a few coins and a text box depicting the caption  "Price to Earnings Ratio calculator". The picture is in bright crimson red.


How to Use the Calculator:
  1. If you are in the 'Home' page, please Click on the post title to enter the 'Post Page' and proceed.
  2. Please Wait for the calculator/ excel sheet to load - it may take a minute depending on the speed of your internet connection.
  3. Please study the post/ article Price to Earnings (PE) Ratio for proper prior understanding.
  4. Please enter your values for current market price (CMP) and earnings per share (EPS).
  5. Please input your values only in the designated cells (filled with yellow) in the excel sheet. All other cells are protected and are not intended to be altered.
  6. To clear the contents of the designated cells please refresh the page.
  7. This price to earnings (PE) ratio calculator is currency neutral - that is it can be used for any currency.


Saturday, October 1, 2016

Where to Find Industry Wise Price to Earnings Ratios for Indian Stocks?

There may be many sites offering PE information industry wise but I will mention about ‘Kotak Stock Filter’, not because of any special affiliation but simply because that was the one I discovered first and have been using it ever since.
The Screen will look like this:
Kotak Stock Filter for Indian Stocks

You can filter stocks on various criteria including industry, current market price (CMP),Market CapitalisationPrice to Earnings Ratio and Earnings Per Share.
Related Links:

Friday, September 23, 2016

Price to Earnings Ratio - Formula

EPS Formula:


Formula to Calculate the Price to Earnings Ratio

Definition:

Price to Earnings or PE ratio is the proportion or relationship, expressed as a number, between the market price of a stock and the scrip's earnings per share or EPS.

Example:


Let us consider the example of the EPS of SJVN Ltd., a company listed on Indian stock exchanges, for the financial year ending on 31st March, 2015.


Example of Calculation of PE Ratio of SJVN Ltd.

Significance:

Price to Earnings Ratio is the first of the two most important metric in determining the fair price of a share, the second being ‘Price to Book Value Ratio'. If the PE Ratio is less than 10, it is a good bargain. Maximum recommended is 10 times, beyond which the price is not fair or reasonable.

Related Links: