Showing posts sorted by date for query dividend yield. Sort by relevance Show all posts

Saturday, August 18, 2018

Dividend Payout Ratio


Dividend Payout Ratio – Meaning

Dividend Payout Ratio measures the proportion of the profits the company distributes to its shareholders as a dividend. The part that is held back is called retained earnings.


Dividend Payout Ratio – Formula


Dividend Payout Ratio – Example 

Rural Electrification Corporation Ltd. (REC)’ earned Rs.6,245.76 crores (1 crore = ten million) as profits after all expenses, including income tax. This sum is called the net profit or profit after tax or PAT earned by the company. REC distributes Rs.1,881.06 crores by way of dividends.

Applying the formula described above, we see that the dividend payout ratio works out to 30.12%.


Importance of Dividend and Dividend Payout

Dividends are the wages of the investors. Whatever may be the companies earnings the fruits or rewards that flow into the hands of investors is only the dividend. Therefore companies should distribute a sizeable portion of the profits to the shareholders in the form of dividends. However, most often we find that management of companies tend to be stingy when it comes to distribution of dividends. They justify the nonpayment or inadequate payment on the grounds that they are retaining the profits for business growth. This is stand is totally unfair and unjustified. For history shows that many companies that have not paid dividends one day became bankrupt. And what did the investors get in return? Nothing! Neither dividends while the company was doing well nor the return of the capital invested - for after becoming broke the shares became worthless.

Now, what is the proportion of profit distribution by way dividends that is considered good?

In my opinion and experience, 25% of the net profits is the bare minimum. 30% is reasonable and good. Anything above 30% is appreciable and welcome.

I present here five companies each that:

  • Paid no dividends despite having profits, 
  • Distributed between 25 to 30% of their net profits as dividends and 
  • Those that distributed over 40% of their net profits in the form of dividends 

The above data relates to the last financial year, that is the year ending 31st March 2017.

Conclusion

Dividend payout ratio means the percentage of net profits of a company distributed by way of dividends among shareholders. As investors, we should invest only those companies that are generous in distributing dividends. The reason is that as investors dividends are the essential, regular returns on investments. We should penalise the companies that pay no or negligible dividends on the pretext of the growth of the company.


Related Reading


Wednesday, August 15, 2018

Glorious Indian Stocks to Buy this August 2018

Glorious Indian Stocks to Buy this August 2018 : Post Feature Image

I present here the glorious Indian stocks to buy this August 2018. Only this morning I invested Rs.10,000 in these stocks. You can invest in them too.

All the 20 stocks both from the existing 'Portfolio 2K15' as well as the new finds were ordered into four grades “A” to “D” and “Rejected/ Not Analysed”. The classification is primarily based on the ROE. I tinkered with and redefined the rules of grouping. The status of the 20 stocks and their grading is depicted below:
Glorious Indian Stocks to Buy this August 2018 : Stocks, Grades and Rules of Grading

The Rules of Grading

Glorious Indian stocks to buy this August 2018: Grade A

  • Average ROE for the last 14 years is greater than or equal to 20% and
  • The ROE for the year 2017 is greater than or equal to 5% but lesser than 8%


Grade B

  • Average ROE for the last 14 years is greater than or equal to 15% and
  • The ROE for the year 2017 is greater than or equal to 5%

Grade C

  • Average ROE for the last 14 years is greater than or equal to 10% but less than 15% and
  • The ROE for the year 2017 is greater than or equal to 10%


Grade D

  • Average ROE for the last 14 years is less over 0%


Distribution of Investible Sum

The investible sum of Rs,10,000/- was distributed to the four groups as follows:
  • Grade A: Rs.7,015/-
  • The Grade B: Rs.1.343/-
  • Grade C: Rs.1,194/-
  • Grade D: Rs.448/-


You can see that ‘Grade A‘ commands the lion’s share of the sum of Rs.2000 – a whopping 70.15%. This is because of two reasons. The high ROE generated by the scrips of over 20% per annum, consistently for over 14 years. Further, there are seven stocks out of a total of 17 that have made it to this grade. Thus based on the number of scrips Grade A grabbed 41.18% (7*100/17).

Following table depicts the allocation based on grades, the number of scrips falling in the grades and the combined (multiplied, for in mathematics combined means a product and not an addition or sum):

Glorious Indian Stocks to Buy this August 2018: Norms Selection, Rejection and Distributing the Investible Sum

In my new scheme of things following are the measures for allocating the investment:


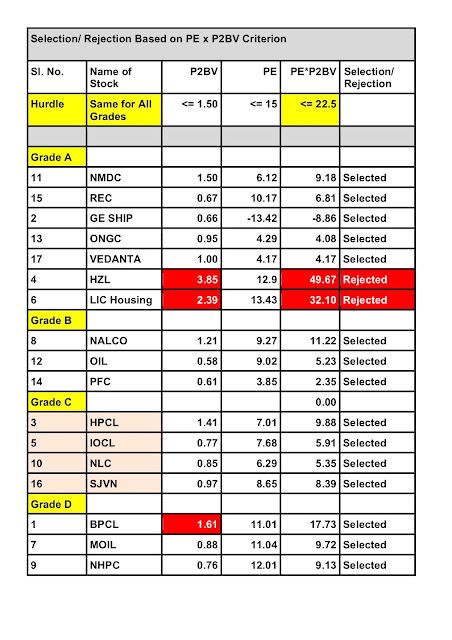
The combined  ‘Price to Earnings and Price to Book Value’ ratio is only used to determine whether a stock is expensive. I have not made any allocation of money under this norm. If a stock fails this test (PE*P2BV Ratio shall be less than 22.50), then the stock is expensive and is eliminated. No allocation of investment is made to the stock. For example, even though Hindustan Zinc and LIC Housing Finance had made it to Grade A, I have eliminated them. Their combined ratios stand at 49.67 and 32.10 respectively.
On the other hand, if a stock fails under any other criterion it simply will not get any allocation under that criterion. It will not be totally eliminated. For example, the Great Eastern Shipping Company Ltd.’s PE ration on 1st August 2018 was 28.42, more than the permissible 15. Its dividend yield on that day was 2.38%, below the minimum permissible 4%. Still, I did not totally eliminate it. Please observe the following table for selection/ rejection based on the combined ‘PE*P2BV Ratio’ criterion:
Glorious Indian Stocks to Buy this August 2018 : Allocation Based on Price-to-Book-Value Ratio Criterion

Glorious Indian Stocks to Buy this August 2018: Summary of Allocation and Number of Stocks to Buy


Finally, after allocating Rs.10,000/- as described above we get the summarised results as depicted in the following picture:

Glorious Indian Stocks to Buy this August 2018 : Summary of Total Allocation of Funds and the number of stocks to buy


Allocation Based on 14 Year Average ROE

I present here the distribution of Rs.2,000 among various stocks based on the '14 Year Average ROE Criterion':
Glorious Indian Stocks to Buy this August 2018 : Allocation Based on 14 Year ROE Criterion


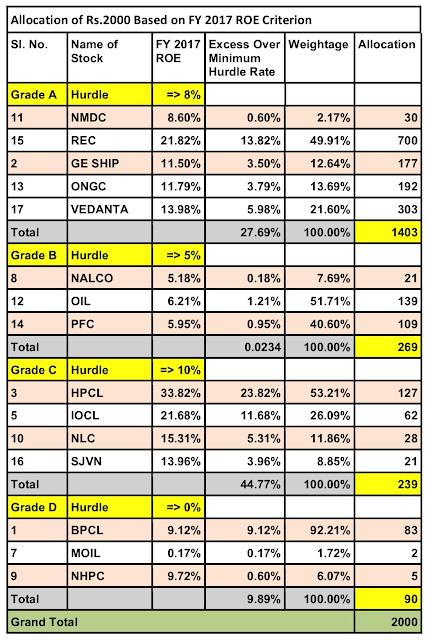
Allocation Based on Financial Year 2017 ROE

I show the distribution of the next Rs.2000 investment based on the ‘Financial Year 2017 ROE’ criterion in the following table:

Glorious Indian Stocks to Buy this August 2018 : Allocation Based on FY 2017 ROE Criterion


Glorious Indian Stocks to Buy this August 2018: Allocation Based on Price to Book Value Ratio

I have worked the distribution of the next Rs.2000 based on the price to book value ratio as follows:
Glorious Indian Stocks to Buy this August 2018 : Allocation Based on price-to-book-value ratio criterion

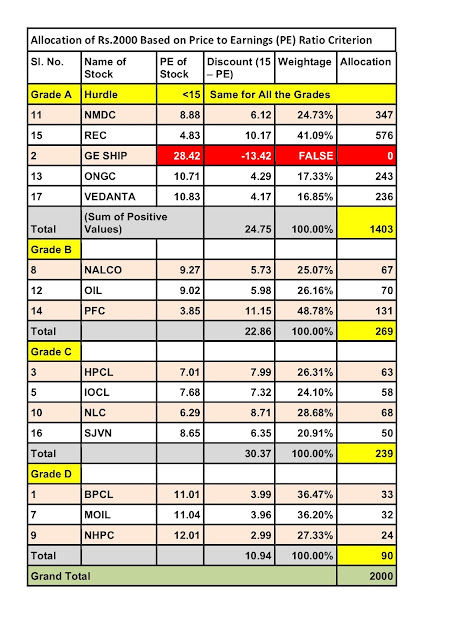
Allocation Based on Price to Earnings Ratio

Glorious Indian Stocks to Buy this August 2018 : Allocation based on PE Criterion

Glorious Indian Stocks to Buy this August 2018: Allocation Based on Dividend Criterion

I present below the fifth and the last Rs.2000 of investment based on the dividend yield criterion.
Glorious Indian Stocks to Buy this August 2018 : Allocation Based on Dividend Yield Criterion

Conclusion

These are the ‘Glorious Indian Stocks to Buy this August 2018‘. I have invested my Rs.10000 in the same stocks, exactly in the same proportion. You too can safely invest and benefit from the investment over a very long period of time. Happy investing!