Rashtriya
Chemicals and Fertilisers Ltd.
Company history and business:
Rashtriya
Chemicals & Fertilizers Ltd. (RCF), incorporated in the year 1978, is a Mid
Cap company (having a market cap of 3213.58 Cr.) operating in Fertilisers sector.
Rashtriya Chemicals and Fertilizers Limited (RCF)
a Government of India Undertaking is a leading fertilizer and chemical
manufacturing company with about 80% of its equity held by the Government of
India. It has two operating units, one at Trombay in Mumbai and the other at
Thal, Raigad district, about 100 KM from Mumbai. Government of India has
accorded "Mini-Ratna" status to RCF.
RCF is one of the earliest units set up in the
country for fertilizer production. It manufactures Urea, Complex Fertilizers,
Bio-fertilizers, Micro-nutrients, 100 per cent water soluble fertilizers, soil
conditioners and a wide range of Industrial Chemicals. It produces 23 lac MT
Urea, 6.5 lac MT Complex fertilizers and 1.6 lac MT of Industrial Chemicals
every year. The company is a household name in rural India with brands
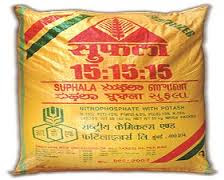
"Ujjwala" (urea) and "Suphala" (complex fertilizers) which
carry a high brand equity. RCF has countrywide marketing network in all major
states. Apart from the own manufactured products, the Company is also engaged
in marketing of SSP and imported fertilizer inputs like, DAP, MOP & NPK
fertilizers. Besides fertilizer products, RCF also produces almost twenty
industrial chemicals that are important for the manufacture of dyes, solvents,
leather, pharmaceuticals and a host of other industrial products.
RCF’s key
Products/Revenue Segments include Subsidy which contributed 4574.00 Cr to Sales Value (52.02 % of Total
Sales), Neem Coated Urea which contributed 1276.47 Cr to Sales Value (14.51 % of Total
Sales), Suphala 15:15:15 which contributed 1041.35 Cr to Sales Value (11.84 %
of Total Sales), other products contributed the balance.
 |
| RCF's bag of fertilizer, "Saphala |
Basic Filtering Criteria:
 |
| Rashtriya Chemicals & Fertilisers Ltd Share's market Snapshot |
(Rs. Crore/ Rs. 10 million)
|
Minimum Required
|
Actual
|
||
1
|
Turnover
|
1000
|
8,649
|
Pass
|
2
|
Market Capitalization
|
1000
|
3213
|
Pass
|
3
|
Price to Earnings Ratio
|
Less than 15
|
20.25
|
Fail
|
4
|
Price to Book Value
|
Less than 1.5
|
1.09
|
Pass
|
5
|
Dividend Yield
|
4-5%
|
1.96%
|
Fail
|
As per basic value investing filtering
criteria Rashtriya Chemicals’s share can be taken up as it passes three out of
the five filtering criteria.
 |
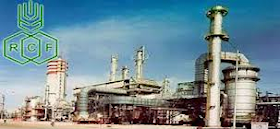
| Rashtriya Chemicals & Fertilisers Ltd's Factory Panoramic View |
A. Company Performance
Profitability
Analysis
Rashtriya Chemicals & Fertilizers Ltd.
Profit & Loss Account (Rs. Crore/ Rs. 10 million)
|
Mar ' 16
|
Mar ' 15
|
Mar ' 14
|
Income:
|
|||
Operating income
|
8,649.43
|
7,713.45
|
6,587.60
|
Expenses:
|
|||
Material consumed
|
4,185.71
|
3,691.05
|
3,289.44
|
Manufacturing expenses
|
2,380.21
|
1,576.37
|
1,318.92
|
Personnel expenses
|
492.44
|
526.24
|
442
|
Adminstrative expenses
|
1,124.73
|
1,109.45
|
970.92
|
Cost of sales
|
8,183.09
|
6,903.11
|
6,021.28
|
Operating profit (EBDITA)
|
466.34
|
810.34
|
566.32
|
Financial expenses
|
142.32
|
116.95
|
131.29
|
Depreciation
|
145.13
|
258.12
|
141.75
|
Other income
|
112.21
|
74.36
|
74.04
|
PBT
|
291.1
|
509.63
|
367.32
|
Tax charges
|
99.87
|
187.57
|
117.43
|
PAT
|
191.23
|
322.06
|
249.89
|
EBDITA % to Sales
|
5.39%
|
10.51%
|
8.60%
|
EBT % to Sales
|
2.07%
|
5.64%
|
4.45%
|
Interest Cost as %
of Sales
|
1.65%
|
1.52%
|
1.99%
|
PBT % to Sales
|
3.37%
|
6.61%
|
5.58%
|
PAT % to Sales
|
2.21%
|
4.18%
|
3.79%
|
Highlights:
- Over 50% of sales revenues comprise of subsidy from government, making the companies profitability and cash flows dependent and vulnerable.
- P&L Account reveals very low profitability margins though there are no losses.
- Interest cost constitutes a significant proportion of already weak profitability margin.
On
profitability parameter the company’s performance appears poor.
Balance Sheet Analysis
Rashtriya Chemicals Ltd.
Balance Sheet (Rs. Crore/ Rs. 10 million)
|
Mar '
16
|
Mar '
15
|
Mar '
14
|
Sources
of funds
|
|||
Equity share capital
|
551.69
|
551.69
|
551.69
|
Reserves & surplus
|
2277.43
|
2159.24
|
1956.70
|
Net Worth ( C )
|
2829.12
|
2710.93
|
2508.39
|
Secured loans
|
1289.61
|
964.82
|
1128.68
|
Unsecured loans
|
1466.43
|
919.63
|
538.41
|
Total Loan Funds (A)
|
2756.04
|
1884.45
|
1667.09
|
Current liabilities & provisions (B)
|
2100.86
|
1644.42
|
1439.37
|
Total Liabilities
|
7686.02
|
6239.80
|
5614.85
|
Uses of
funds
|
|||
Fixed assets
|
|||
Net block
|
1496.56
|
1501.04
|
1619.67
|
Capital work-in-progress
|
149.97
|
61.16
|
77.19
|
Total Fixed Assets
|
1646.53
|
1562.20
|
1696.86
|
Investments
|
0.19
|
0.17
|
17.86
|
Current assets, loans & advances
|
6039.30
|
4677.43
|
3900.13
|
Miscellaneous expenses not written off (D)
|
0.00
|
0.00
|
0.00
|
Total Assets
|
7686.02
|
6239.80
|
5614.85
|
Total Outside Liabilities (TOL) = A+B
|
4856.90
|
3528.87
|
3106.46
|
Tangible Net Woth (TNW) (C-D)
|
2829.12
|
2710.93
|
2508.39
|
Current Ratio
|
2.87
|
2.84
|
2.71
|
Long Term Debt Equity Ratio
|
0.97
|
0.70
|
0.66
|
Total Outside Liabilities/ Tangible Net Worth TOL/ TNW
|
1.72
|
1.30
|
1.24
|
Highlights:
- Current Ratio is strong at 2.87 but only a marginal improvement over last year, indicating low profits unable to improve liquidity significantly.
- Debt equity ratio declined from 0.66 in FY 2013-14 to 0.97 in FY 2015-16.
- TOL/ TNW Ratio too has deteriorated from 1.24 to.
Overall, the Balance Sheet of Rashtriya
Chemicals though strong is depicting deterioration.
 |
| Fortified entrance to one of RCF's Facilities |
Cash Flow Analysis:
Cash Flow Statement (Rs. Crore/ Rs. 10 million)
|
Mar '
16
|
Mar '
15
|
Mar '
14
|
Mar '
13
|
Mar '
12
|
Profit before tax
|
291.1
|
509.63
|
367.32
|
380.12
|
374.46
|
Net cash flow-operating activity
|
-635.65
|
228.05
|
313.73
|
-587.68
|
-155.53
|
Net cash used in investing activity
|
-260.14
|
-216.41
|
-81.88
|
229.07
|
-786.94
|
Net cash used in fin. activity
|
813.92
|
2.87
|
-208.25
|
307.07
|
620.5
|
Net inc/dec in cash and equivalent
|
-81.87
|
14.51
|
23.6
|
-51.54
|
-321.97
|
Cash and equivalent begin of year
|
83.23
|
68.72
|
45.63
|
97.17
|
419.14
|
Cash and equivalent end of year
|
1.36
|
83.23
|
69.23
|
45.63
|
97.17
|
Highlights:
- Net Cash Flow from operating activities or free cash flow, which is the backbone of the company’s health are negative (in the red ) in three out of five years.
- Positive figures in Net Cash used in financing activity indicate borrowings. In those three years of negative operating cash flows the company resorted to heavy borrowing.
Overall RCF’s cash flows show
fundamental structural weakness.
Dividend Track Record
Year
|
Dividend (%) of
Face Value of Shares
|
2016
|
11
|
2015
|
18
|
2014
|
15
|
2013
|
15
|
2012
|
14
|
2011
|
11
|
2010
|
11
|
2009
|
12
|
2008
|
10
|
2007
|
10
|
2006
|
10
|
2005
|
17
|
2004
|
17
|
2002
|
2
|
2001
|
4
|
2000
|
2
|
1999
|
6
|
1998
|
5
|
1997
|
2
|
Highlights:
Company’s
uninterrupted dividend paying track record is very strong. At least for 19 long
years the company has paid dividends without break!
On
this parameter the company’s performance is Excellent.
Dividend Pay-out Ratio
Mar '
16
|
Mar '
15
|
Mar '
14
|
Mar '
13
|
Mar '
12
|
|
Profit After Tax (PAT)
|
191.23
|
322.06
|
249.89
|
280.9
|
249.24
|
Equity dividend
|
48.34
|
79.08
|
68.71
|
68.69
|
64.71
|
Dividend tax
|
12.35
|
20.22
|
14.04
|
14.06
|
12.53
|
Total
Dividend Pay-out
|
60.69
|
99.3
|
82.75
|
82.75
|
77.24
|
Dividend
Pay-out Ratio
|
31.74%
|
30.83%
|
33.11%
|
29.46%
|
30.99%
|
Highlights:
- It is quite evident from the above that the company is distributing a good portion of its profits as dividends.
- Unfortunately in an effort to maintain this reputation and in the face of negative operating cash flows, the company is borrowing heavily – in short dividends are paid from borrowed money. This is certainly not good for either the company or the investors in the long run.
On this parameter the company’s track
record is excellent, but harmful for the company and its investors.
B. Market Conditions:
Price to Earnings Ratio:
A PE Ratio of
20.25 is not favorable.
Market
condition on this parameter is not favorable.
Price to Book Value per Share: With a price to book value ratio at 1.09
the market condition is below the maximum permitted 1.5 and therefore is
favorable. Of course the assets are not available on a discount – they are just
available at their full value with a slight premium attached.
Market
condition on this parameter is favorable.
Dividend Yield:
Dividend yield
of 1.96 is poor. The low dividend is caused by low profits. Company has to be
praised for shelling out over 30% of profits towards dividends.
Market
condition on this parameter is unfavorable, but the company can be forgiven.
Distance from 52 week high: The share price is far away from the 52
week low and very near the 52 week high.
Five-year price graph:
 |
| Five years price graph of RCF Ltd.'s Share |
The price graph
clearly shows that after falling steeply for about two and a half years from
middle of 2012 again the price climbed steeply from middle 2014, seesawing
thereafter.
Therefore
current market condition is not very favourable.
Five-year share price return:
 |
| Rashtriya Chemicals Share Five Year Returns |
Table shows that even though the share
price of RCF has appreciated over 34% in the last one year, 78% in the last
three years and about 8% lower than what it was five years ago – which means
that you are able to buy the share below what was prevailing five years back.
But we must understand that the EPS of RCF’s share was 23% more at Rs.4.52
compared to the FY-2015-16’s Rs.3.47.
On
this parameter the market condition is not favourable.
C. Final Conclusions:
- Rashtriya Chemicals Ltd. is a good company but operates in a wrong sector - agriculture. Receiving government subsidy and erratic weather are two adverse environmental factors inherent to the business model.
- Profits are low.
- Operating cash flows have been negative in three out of five years in the past. Company is borrowing to bridge the gap, further eroding profitability margins.
- Balance sheet ratios though is strong zone are declining continuously.
- Market conditions are not very favourable either.
D. Final Investment Advice:
Avoid
investing in this company.
Post Disclaimer: Opinions expressed here are the author’s personal opinions. Market conditions have a great bearing on many end results discussed in this report. No disrespect is intended towards the company, it’s management. Investors are advised not rely blindly on the opinions expressed herein but to exercise their own judgment. Neither the author nor the blog shall be responsible for any loss suffered by either acting or not acting based on the opinions expressed herein.


Thanks for providing such a great article, this article is very help full for me, a lot of thanks
ReplyDeleteSell Ku RC Crystal on Line,
Purchase Yellow Research Chemical Powder in Florida
This comment has been removed by the author.
ReplyDelete