Pages

Friday, March 31, 2017

Gift Your Child Financial Freedom!

Actual Question:

Hello Anand. I agree that mutual funds cannot be looked at for short term. But is it practical to set a term horizon for 30–50 years? Most of us young professionals in late twenties/early thirties would be 60–80 years old by that time. So is mutual fund only applicable for retirement planning or can we realise goals in 10–15 years?

Answer:

Dear Friend!

Good results will certainly be produced in 10–15 years. There is no doubt about it. But the spectacular compounding benefits will only be produced after 30 years. Please read the article Miracle of Compounding to understand why it is so. 

Therefore, the best takeaway from this discussion is a parent can invest for the children a lump sum of say Rs.1,00,000/- at the time of birth and by the time the child grows-up to about 35 years the corpus will be so huge that the child (now a grown-up) is financially free

Picture shows a father raising his little daughter high up in the air. Both are in joy.

Can there be any better gift a parent can give?

Thank you,

With Best Regards
Anand


Is Thematic Investment Good?

Actual Question:

Will thematic investing work In India? Is there a company or a website who helps you invest thematically in India?

Answer:

Dear Friend!
Thank you very much for raising a provoking question. The debate will not only benefit you but a great number of others.

Thematic investment and many other such fashionable names are self-aggrandising innovations of fund mangers to further their personal prospects, actively supported and propagated by funds to somehow attract investors.
Picture shows an investor puzzled by various investment themes peddled by mutual funds

Warren Buffett does not engage in any theme based investment activity. He simply invests in companies that have a sustainable business model, growth, and profits; when such investment opportunities come at a reasonable price. As simple as that.

Every investor can generate significant wealth simply by either investing a single, one time investment of Rs.1,00,000/- or by systematically investing, with strict discipline, without fail, a sum of Rs.5000 to 20000, in a low cost index fund or an exchange traded fund, for a period of 30–35 years.

My dear friend please realise that time generates the spectacular wealth and not human intelligence.

Related topics:


 Thank you,

With Best Regards

Anand

Wednesday, March 29, 2017

Market Prediction and Predictor Slide

Picture Shows a Market Predictor Investor Gazing at the Market

Picture Shows a Investor Gazing at the Market Intending to Make a Prediction

Look At the Business Aspects of the Investment

Picture has two parts: man explaining business model and the other magician performing tricks with stock. A girl is looking at the business aspects


"We are not looking at the aspects of the stock, we 're looking at the aspects of the business."

Warren Buffett

Growth and Value are Inseperable

Picture shows a balanced scale in one corner and investor riding growth in another corner. A chin binds the words Growth and Value.

'Most analysts feel they must choose between two approaches customarily thought to be in opposition: "value" and "growth."... In our opinion, the two approaches are joined at the hip: Growth is always a component in the calculation of value.'

Warren Buffett

Monday, March 27, 2017

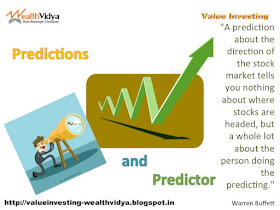
Predictions Tell More About the Predictor

Picture shows a predictor with a telescope and a gazing at a climbing graph


"A prediction about the direction of the stock market tells you nothing about where stocks are headed, but a whole lot about the person doing the predicting."

Warren Buffett

Difference Between Wise and Fool

Picture shows a Joker and a wise old man in two corners: bottom-left and top-right


"What the wise do in the beginning, fools do in the end."

Warren Buffett


Sunday, March 26, 2017

Ignore Political and Economic Forecasts


"We will continue to ignore political and economic forecasts, which are an expensive distraction for many investors and businessmen."

Warren Buffett


Saturday, March 25, 2017

Price to Earnings (PE) Ratio Calculator


Picture shows a calculator a few coins and a text box depicting the caption  "Price to Earnings Ratio calculator". The picture is in bright crimson red.


How to Use the Calculator:
  1. If you are in the 'Home' page, please Click on the post title to enter the 'Post Page' and proceed.
  2. Please Wait for the calculator/ excel sheet to load - it may take a minute depending on the speed of your internet connection.
  3. Please study the post/ article Price to Earnings (PE) Ratio for proper prior understanding.
  4. Please enter your values for current market price (CMP) and earnings per share (EPS).
  5. Please input your values only in the designated cells (filled with yellow) in the excel sheet. All other cells are protected and are not intended to be altered.
  6. To clear the contents of the designated cells please refresh the page.
  7. This price to earnings (PE) ratio calculator is currency neutral - that is it can be used for any currency.


Friday, March 24, 2017

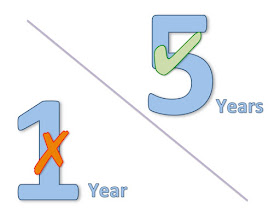
One Year Results are Not Relaible

Picture shows number one in bold but with a cross and number five with a tick mark over it


"Do not take yearly results too seriously. Instead, focus on four- or five-year averages."
Warren Buffett

Hindustan Zinc Dividend Yield Translates to 18.43%

Picture shows the company logo of Hindustan Zinc Limited in black and white. The letters H and Z are depicted inside the Sun

On 22 March 2017, Hindustan Zinc Ltd. declared a special interim dividend of Rs.27.5/share which on a face/ nominal value of the share of Rs.2 translates into a 1375%. This translates into a stellar dividend yield of 16.43%, tax-free!

Our ‘Portfolio 2K15’ holds as on day (25th March 2017) 136 equity shares at an average holding cost of Rs.167.39 (current market price Rs.323.25). Therefore a dividend per share of Rs.27.50 translates into a dividend yield of 16.43% - the icing on the cake is that this dividend is entirely tax-free.

Let us look at the situation from a slightly different angle. The dividend per share of Rs.27.50 on an average holding cost of Rs.167.39 means that the cost of our investment has already been recovered to the extent of Rs.27.50 leaving the average cost holding at Rs.139.89 (167.39 – 27.50), which will further boost the future dividend yields, both regular and special.

Please note that for Hindustan Zinc, being a wonderful company it is, declaring such special dividends is becoming a regular habit. The company had declared a special dividend of 1200% or Rs.24 per share just last year!

After deducting the dividends earned from Hindustan Zinc after this Portfolio 2K15 has been created, the dividend yield after adjusting all the dividends so far amounts to a whopping 18.43%, tax-free.


Assuming that Hindustan Zinc will declare another special dividend next year to the same extent, our dividend yield after reducing all dividends from investment will be 22.60%! Please see the picture below.


Picture Shows the calculation of Effective Dividend Yield in the form of a table


Thursday, March 23, 2017

Hope Diamond Versus Rhinestone

Picture shows the magnificent blue Hope Diamond in comparison with a rhinestones of various colors


"It's far better to own a portion of Hope diamond than 100 percent of a rhinestone."
Warren Buffett


Wednesday, March 22, 2017

Sometimes Markets Get Divorced from Reality

Picture Shows Two Road Signs Divorcing in Opposite Directions in Bright Blue Color

"Periodically, financial markets will become divorced from reality."
Warren Buffett

Monday, March 20, 2017

Earnings Per Share (EPS) Calculator

Picture shows happy boy, a calculator, a sac of dollars

How to Use the Calculator:
  1. If you are in the 'Home' page, please Click on the post title to enter the 'Post Page' and proceed.
  2. Please Wait for the calculator/ excel sheet to load - it may take a minute depending on the speed of your internet connection.
  3. Please study the post/ article Earnings Per Share (EPS) for proper prior understanding.
  4. Please enter your values for net profit, equity capital and face value per share.
  5. Please input your values only in the designated cells (filled with yellow) in the excel sheet. All other cells are protected and are not intended to be altered.
  6. To clear the contents of the designated cells please refresh the page.
  7. This current ratio calculator is currency neutral - that is it can be used for any currency.